.webp)

Before you can receive your impact report, we invite you to fill out the myAclymate survey, a fast and easy carbon footprint calculator designed to ask you a series of questions that will help us accurately estimate your annual carbon emissions. The survey will cover five categories: Home, Travel, Fights, Diet, and Costs. You will have the option of calculating as an individual or a household.
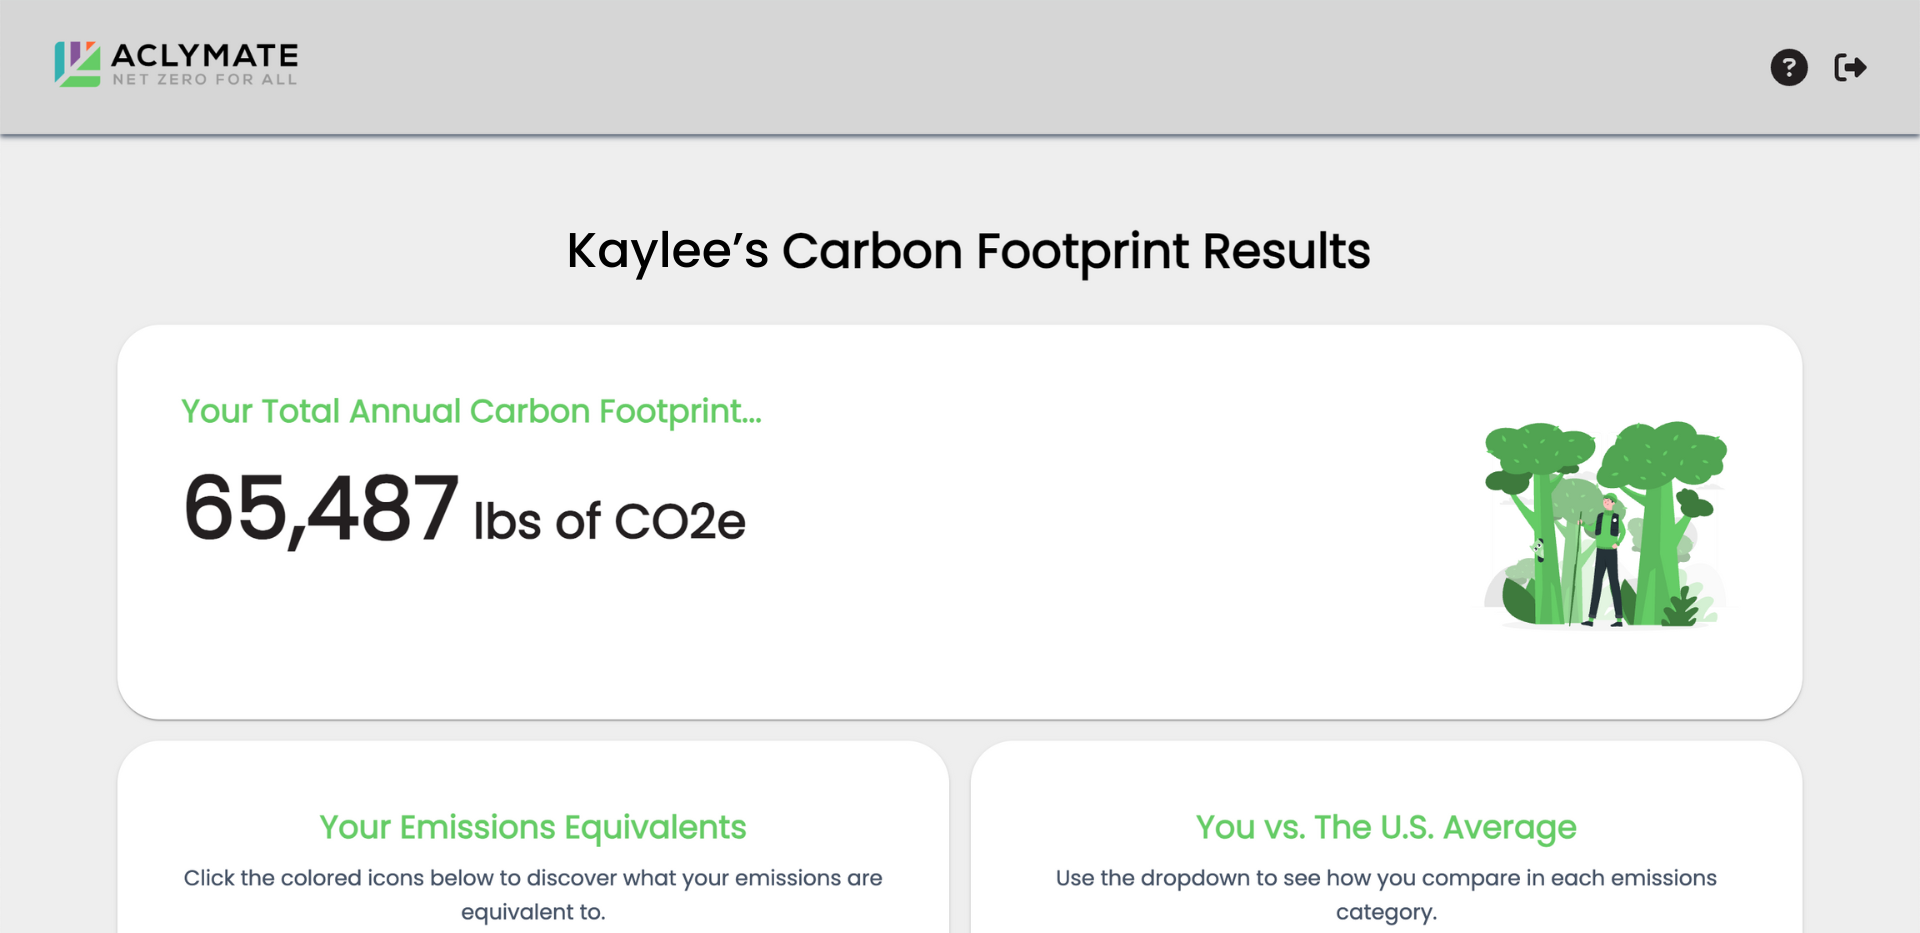
Upon completing the myAclymate survey, you will be directed to your personalized impact report. The impact report will detail your annual carbon emissions, emission equivalents, and a breakdown of how you compare to the US average for each emission category. The report will also allow you to see the impact of your work-related emissions, ways to reduce your annual footprint, and explore the different types of offset projects you can contribute to in order to offset your carbon footprint.

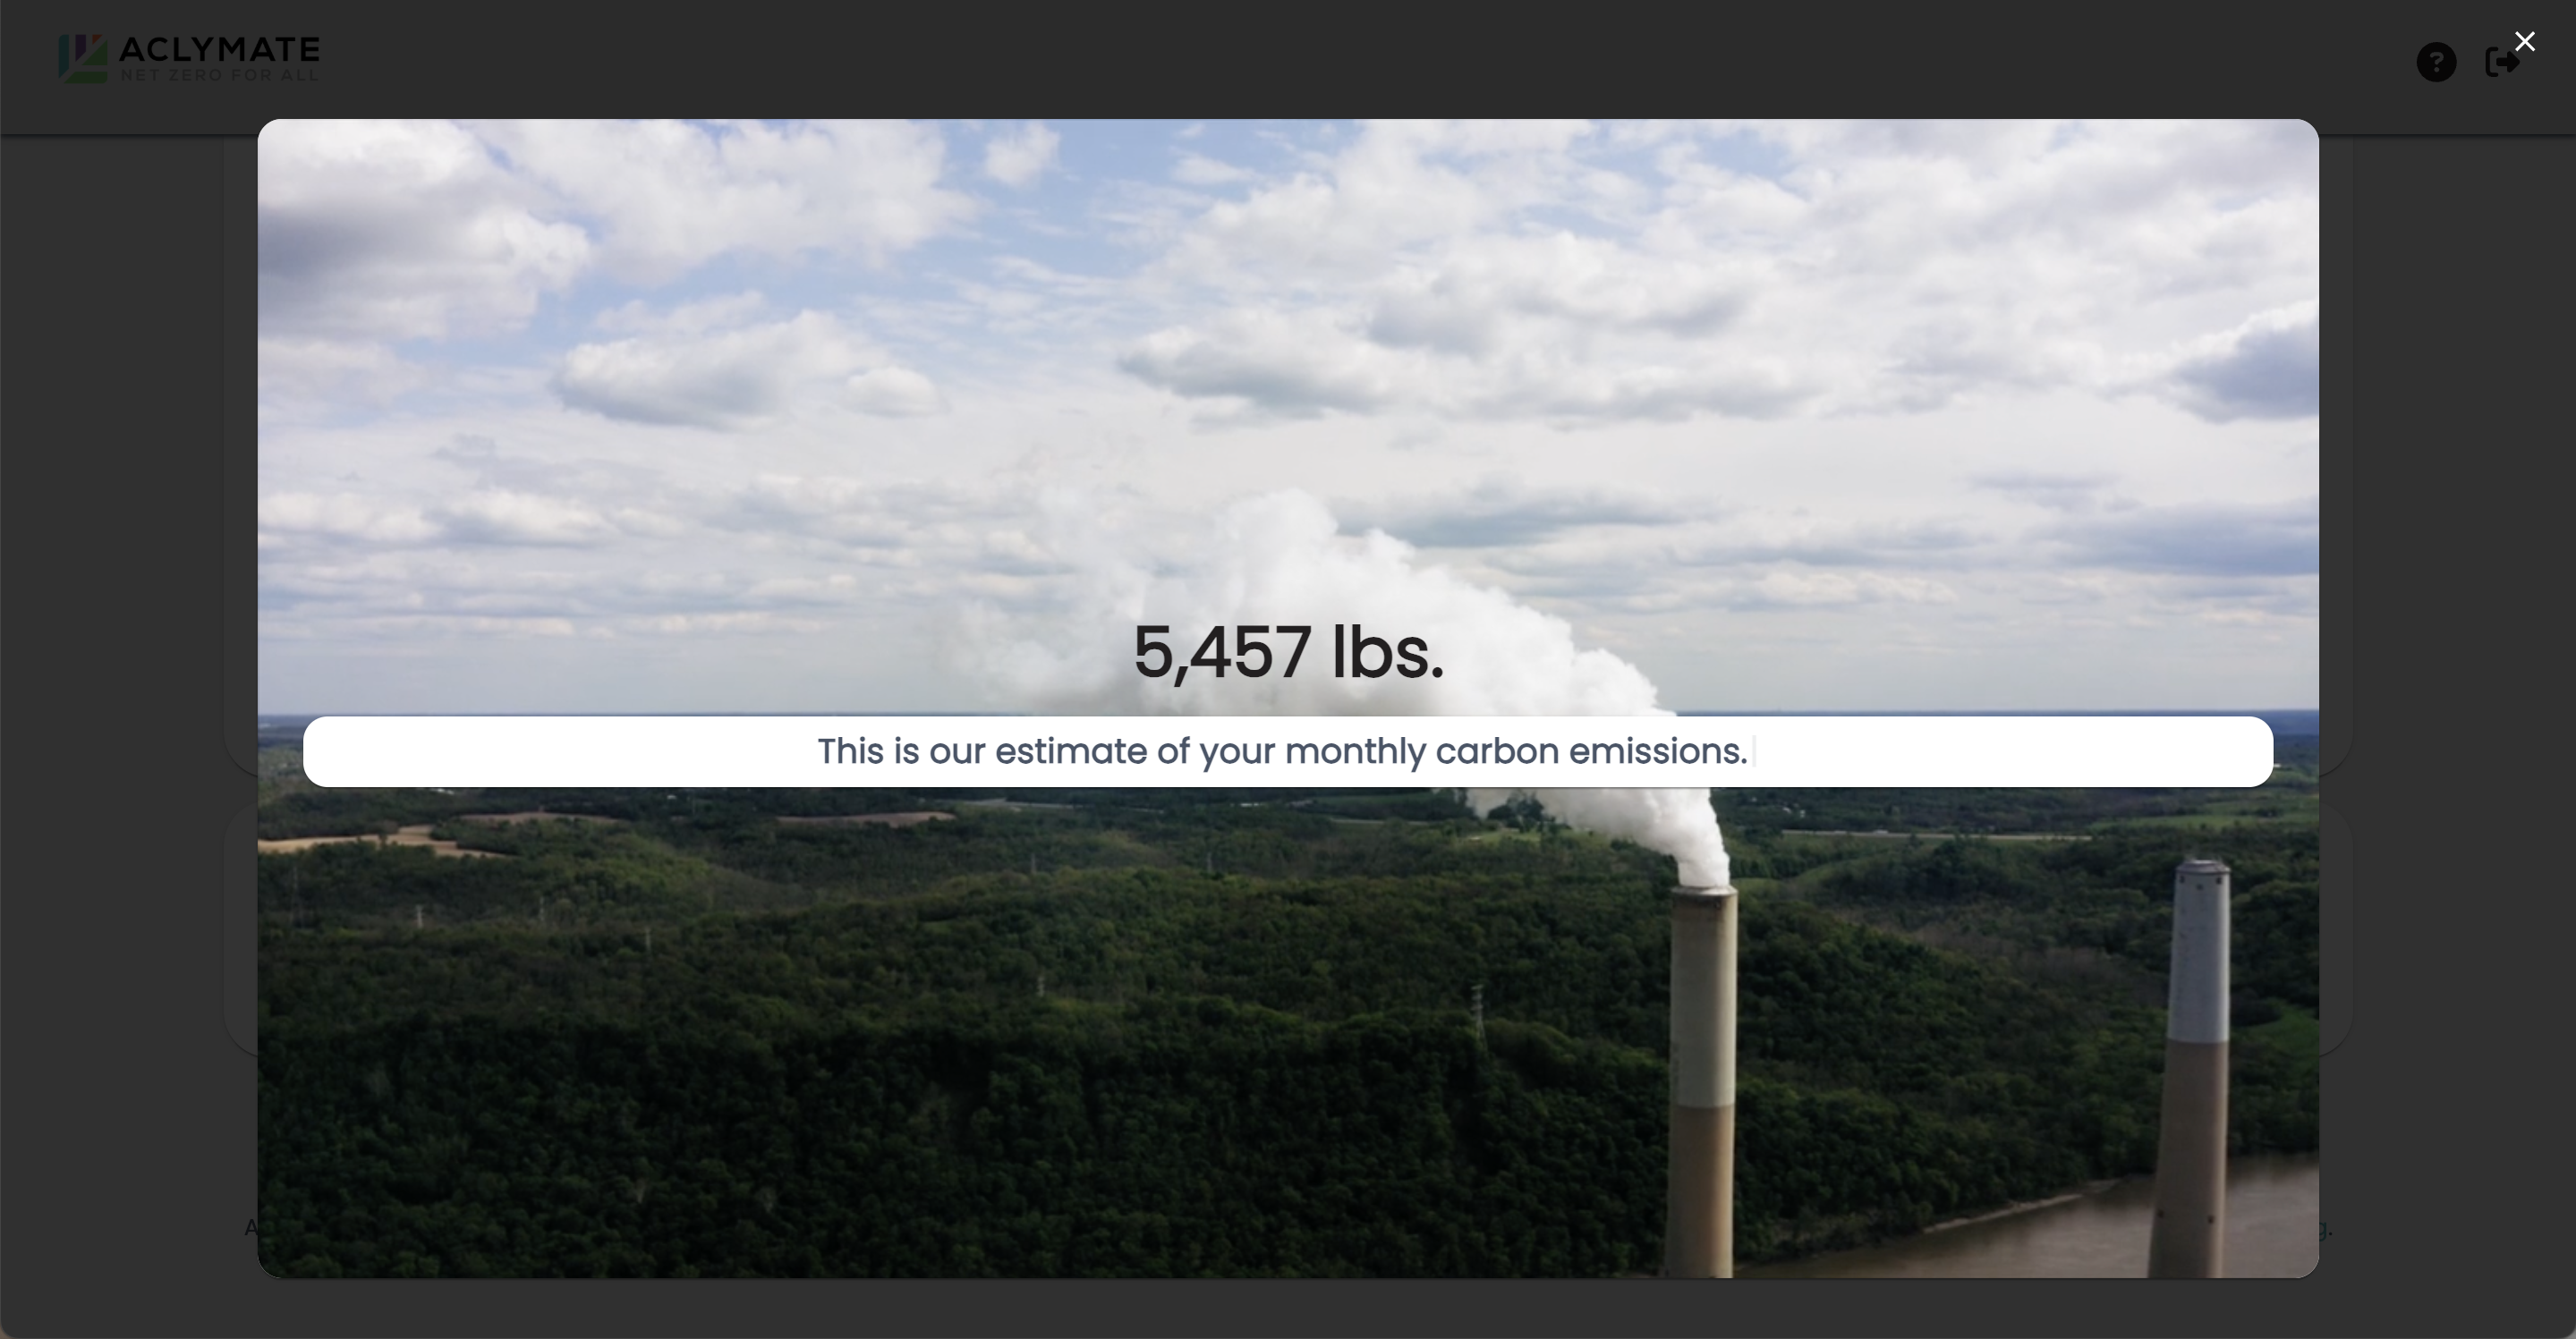
The first thing you will see on your impact report is a video with your total annual carbon emissions, and its equivalents in terms of miles driven, number trees cut down, etc. This number is estimated based on calculations from the Home, Travel, Fights, Diet, and Costs in your myAclymate survey. This number will be reported in pounds of CO2e and used to help compare your carbon footprint to the US Average.
Your Emissions Equivalents section allows you to understand the magnitude of your carbon footprint. Your monthly CO2 emissions are converted into four different equivalents. By clicking on each of the four icons in the section, you can see how your emissions translate into the different categories. When you select the orange steering wheel icon, you will be able to see what your emissions equate to in terms of miles driven. The next icon is the blue icicle, which displays how many square feet of arctic sea ice your emissions could permanently melt. The green hamburger icon displays the number of hamburgers someone could eat that would equate to your emissions. Lastly, the purple cellphone icon shows you how many years your emissions could keep your phone charged.
In the third section of the impact report, you will be able to see how your emissions compare to the average US citizen in each category. First, you’ll see your total emissions, in terms of tons of CO2. Underneath will be a bar graph, with the top bar, your average, in comparison to the bottom bar, the average US citizen. There will be a drop down menu allowing you to see your emissions broken down into five categories: Home, Travel, Flights, Diet, and Expenses. This allows you to quickly see the areas in which you have low or high emissions compared to the US average, and where you may want to reduce.
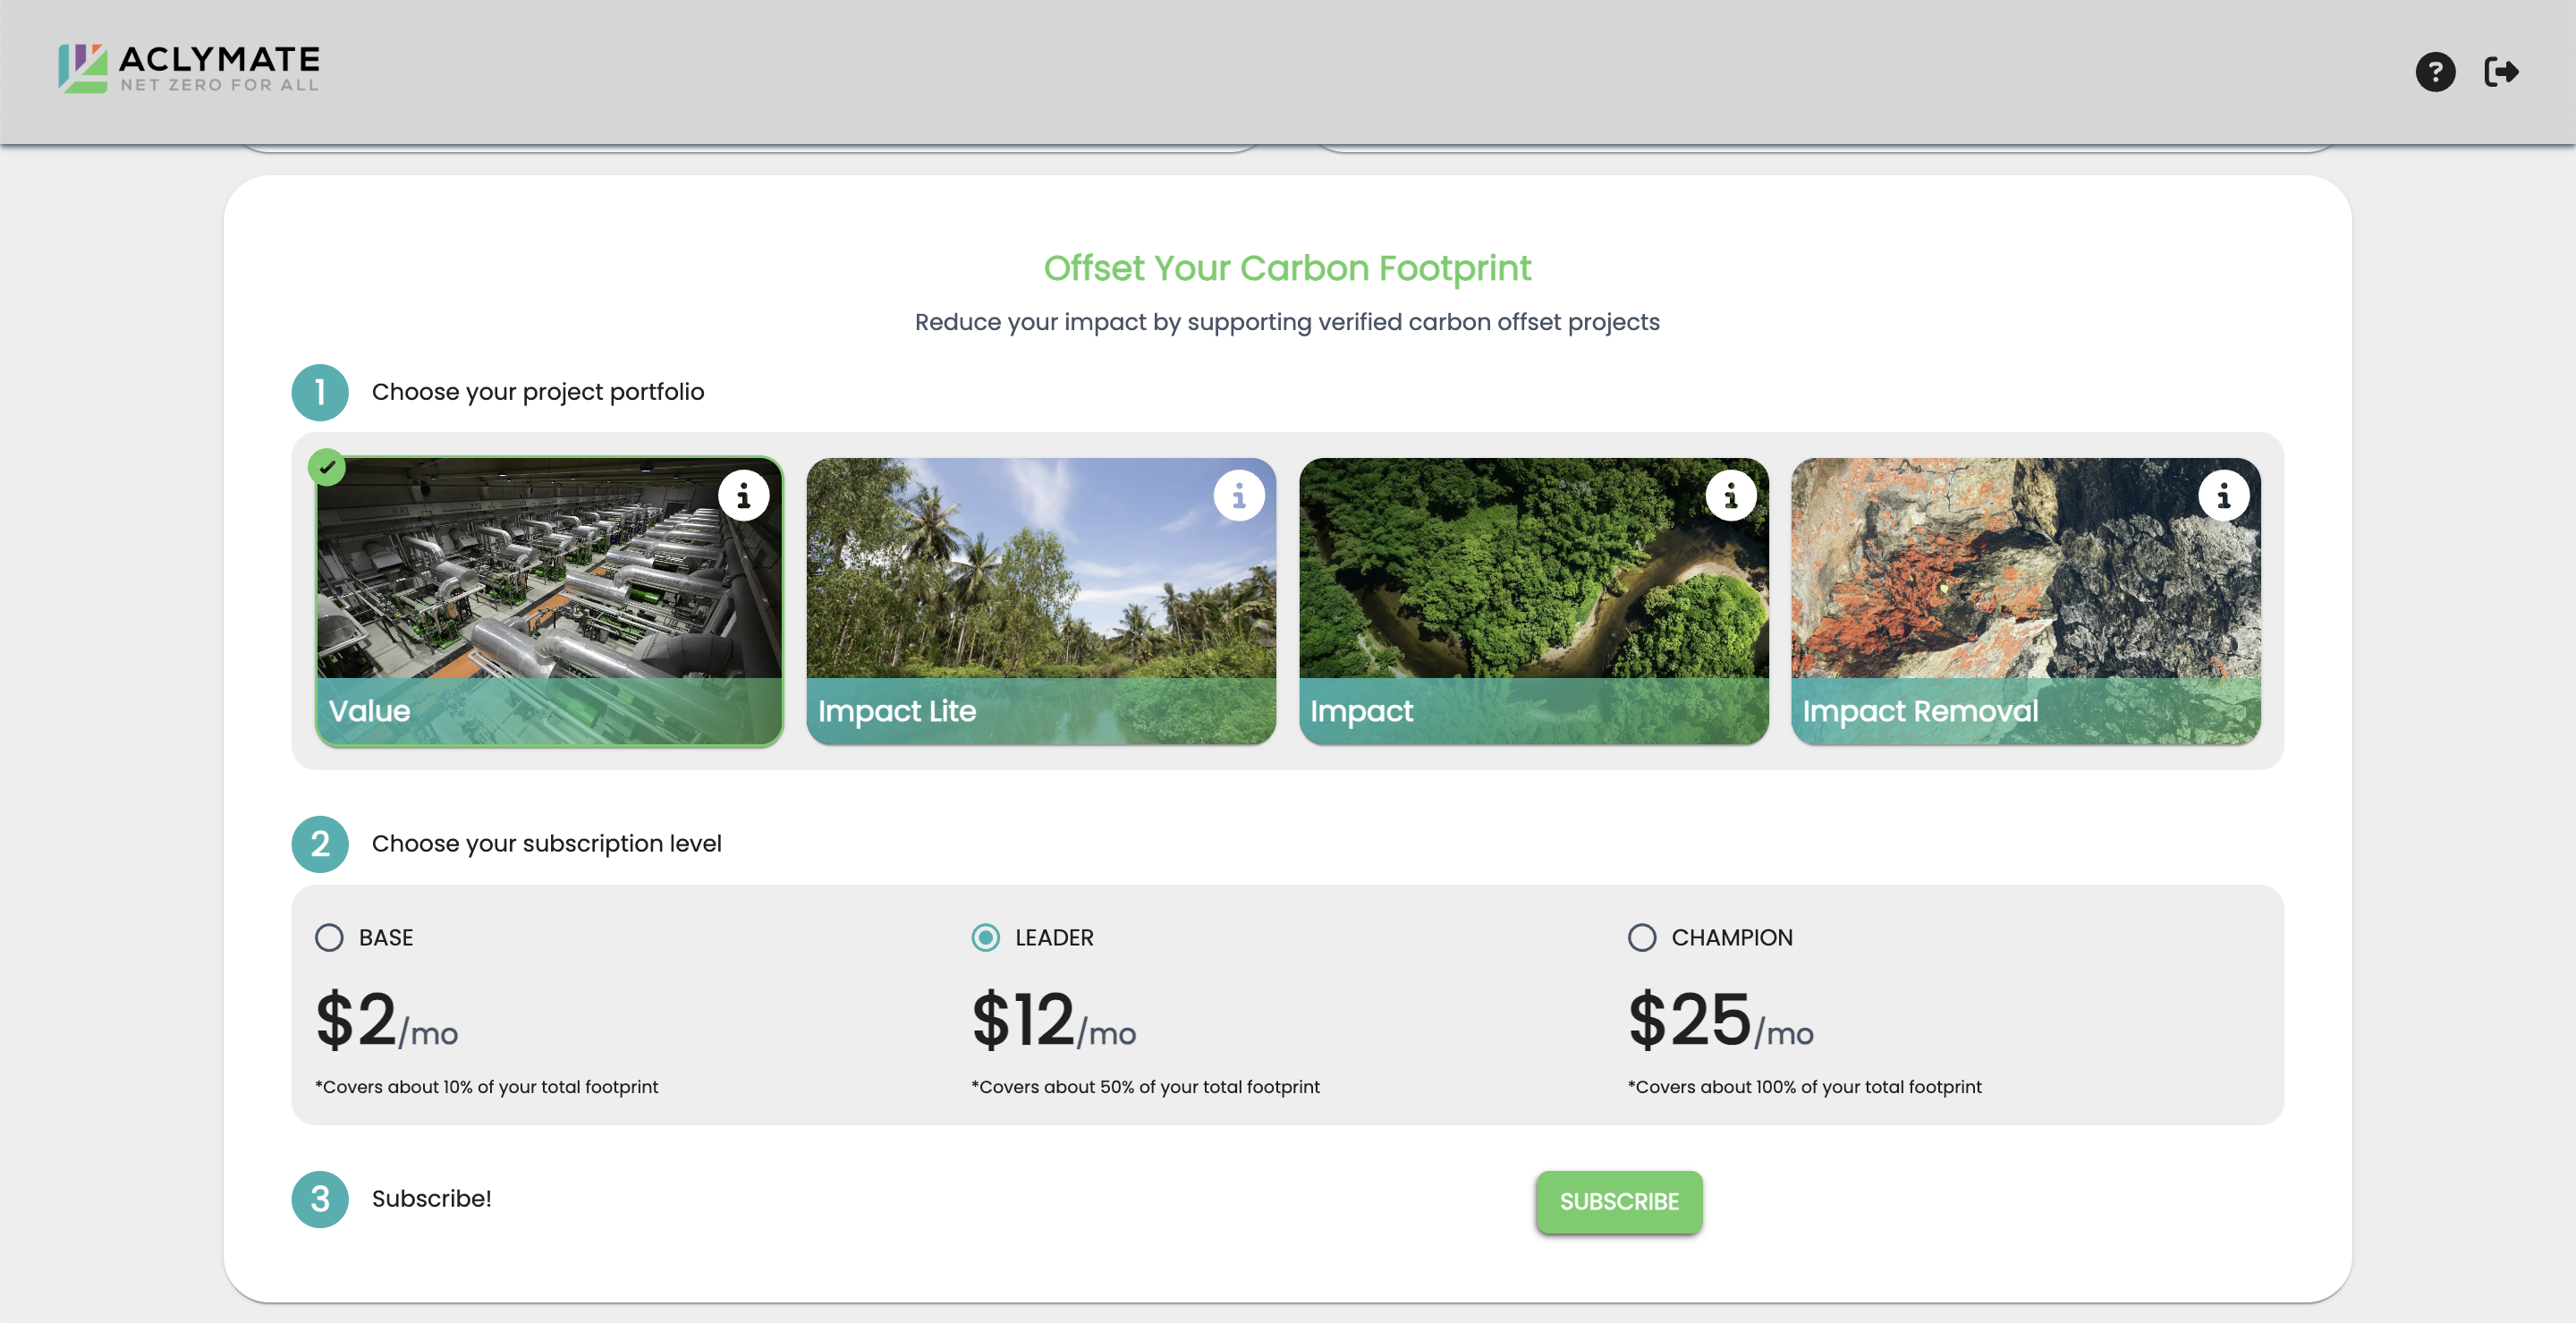
After learning about your emissions and the magnitude of their impact, you will reach the "Offset My Footprint" section. This section gives you the opportunity to subscribe to climate causes cultivated by myAclymate. When you choose to subscribe, you will not only be supporting a collection of offset projects, but you will also be offsetting your entire carbon footprint. For each offset project, an information icon on the upper right corner will lead to a pop-up screen with the project overview, story, UN SDGS, verification, and the option to support. The overview tab will provide you with a description of the project, the type of project it is, project photographs, and the location where the project takes place. The story tab gives you a more in-depth look at the project, how it works, and its impact. The UN SDGS tab stands for the United Nations Sustainable Development Goals. In this section, you will be able to see which goals are satisfied through the offset project. Click here to learn more about the UN SDGS or select the green “Learn More” button at the bottom of the UN SDGS section. The verification tab allows you to see the verification documents, where available, for the offset project you’ve chosen. Lastly, if the feeling is right, you can select the purchase tab and move forward with supporting the project that feels right for you. There are three subscription levels: Base, Leader, and Champion, with corresponding prices.
Towards the bottom of your impact report will be a section that tells you about your work-related emissions. This section will tell you how many pounds of your yearly carbon footprint is made up of work-related emissions. If you wish to learn more about how your company can help you offset these emissions, you can press the blue “Email My Boss” button that is at the bottom of the section. When you click on the button, it will pre-populate an email to send to your boss. The email will contain a link to a page explaining to your boss why your company should get involved in carbon offsets and how Acylmate can help.
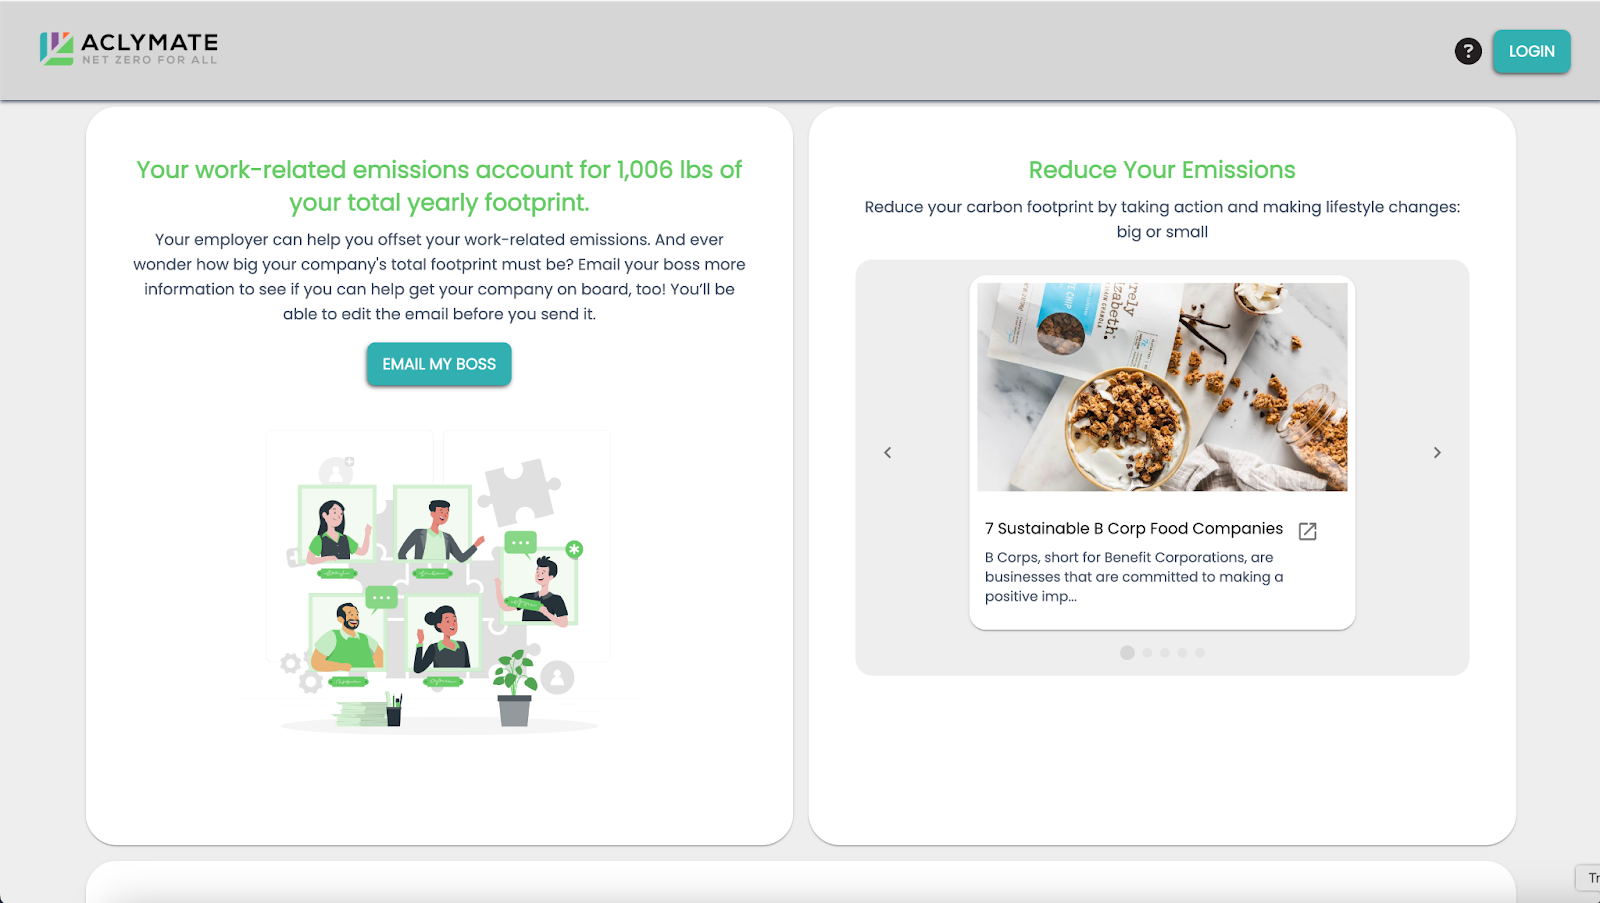
At the end of your impact report will be a section called Reduce Your Emissions with links to blog posts that can be helpful for you along your climate journey. Being climate conscious is a lifestyle and a continuous learning experience and myAclymate is here to help. You can find a range of topics from ways to reduce your carbon footprint to the benefits of offsetting your emissions!