← Back to Insights
Aclymate Team
August 25, 2026
6 min read
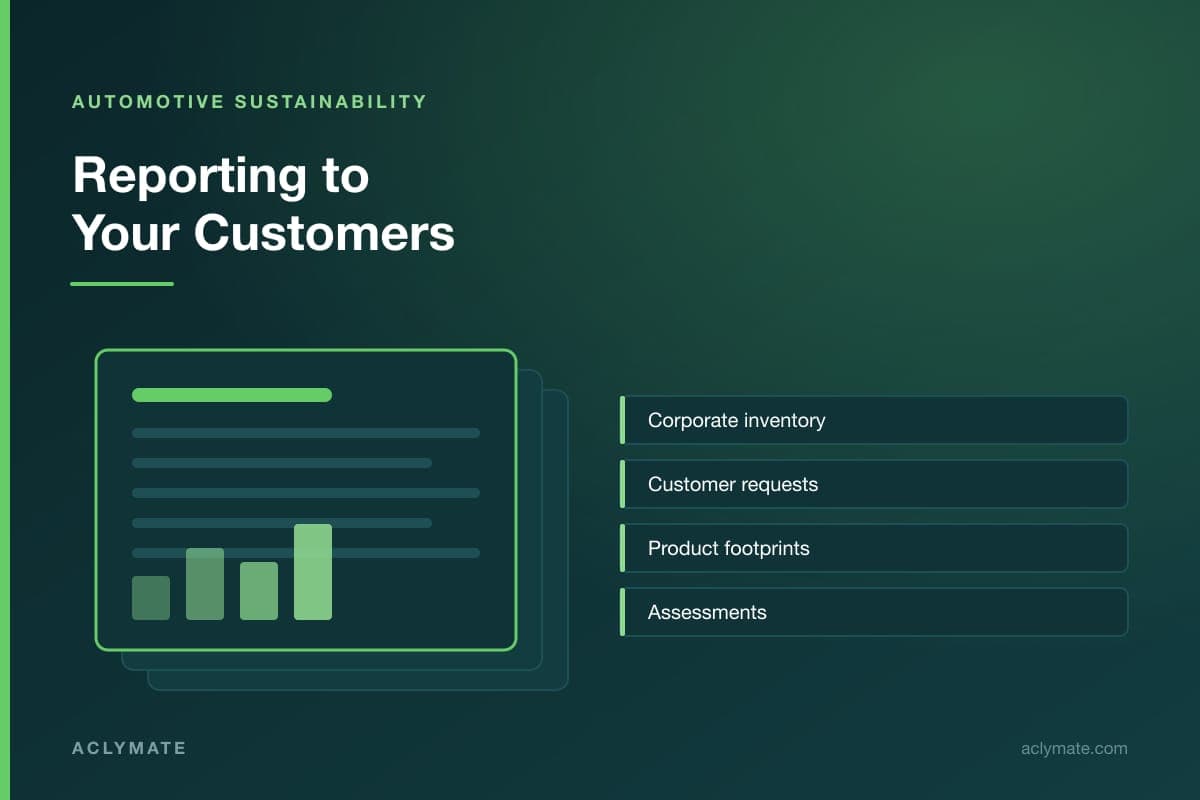
Automotive sustainability reporting is not one activity. It is four, and confusing them is the single most common reason suppliers end up rebuilding the same numbers several times a year.
The four are:
They draw on overlapping data, but they have different boundaries, formats, and audiences. Treating them as a single pile of work is what makes reporting feel endless.
This guide covers each, and how to organize the underlying data so one set of inputs serves all four.
This is your greenhouse gas inventory: Scope 1, Scope 2, and as much of Scope 3 as you can support.
What it needs to state, beyond the numbers:
A number without this context cannot be used by anyone downstream, which is the point of reporting it.
The GHG Protocol is the underlying standard most automotive customers assume you are following. GHG Protocol: Scope 3 FAQ
This is the reporting most automotive suppliers actually spend their time on, and the least standardized.
A customer request typically arrives through procurement, references a deadline, and asks for some subset of: Scope 1 and 2 emissions, energy consumption, Scope 3 information, a PCF for named part numbers, reduction targets, policies, and certifications.
Three practices make this manageable:
Questionnaires go beyond carbon into environmental management, policies, governance, human rights, health and safety, and how you manage your own supply chain.
The main shared format in automotive is the Sustainability Assessment Questionnaire from Drive Sustainability, built so participating automakers can rely on one assessment rather than issuing duplicates, with a lighter SME version for smaller suppliers. Drive Sustainability: SAQ Toolbox
The thing to internalize: questionnaires score evidence, not intent. "Yes, we have an environmental policy" without the attached policy typically scores as no. For most suppliers, gathering documentation is the larger half of the work.
See the SAQ guide.
Product reporting answers a question about a part rather than a company, usually cradle-to-gate.
What makes PCF reporting different from the rest:
This is the category where a repeatable method pays for itself fastest. The first PCF is expensive; the tenth should not be.
See automotive Product Carbon Footprints and the Product Footprint Pack.
Scope 3 deserves separate mention because it is the category most likely to be misread.
When an automotive customer asks about your Scope 3, they are usually asking about Category 1, purchased goods and services — the materials and components you buy — because that feeds their own inventory.
They are not usually asking you to produce a complete fifteen-category Scope 3 inventory. Clarifying which categories are in scope before you begin saves a great deal of unnecessary work.
Reporting Scope 3 honestly means labelling data quality. A spend-based estimate presented as measured data is a problem; a spend-based estimate labelled as such is a perfectly reasonable answer for a first year. See Scope 3 reporting requirements.
EcoVadis is a third-party assessment producing a scorecard across environment, labor and human rights, ethics, and sustainable procurement, visible to customers who request it.
It is documentation-led in the same way the SAQ is. A company with good practices and poor record-keeping scores badly, which is frustrating but is the system working as designed — the assessment can only evaluate what it can see.
EcoVadis consulting covers preparation.
Every form of reporting above increasingly requires the working, not just the result.
The evidence pack that satisfies most requests:
Assembled once and maintained, this pack answers most of what arrives.
Customers increasingly ask not just for numbers but for an indication of how good they are.
A simple, defensible way to label each figure:
Labelling estimates as estimates builds more credibility than presenting everything with equal confidence. Sophisticated customers can tell the difference, and the ones who cannot will find out during assurance.
The goal is one data foundation feeding four outputs.
What that looks like in practice:
Suppliers who run this way answer customer requests in days. Suppliers who do not spend several weeks per request, every time, indefinitely.
Aclymate is built to be that single data foundation, with expert support for the interpretation work.
See the Automotive & Transportation page, the wider guide to sustainability in the automotive industry, or reporting software for automotive suppliers.
It covers four distinct activities: corporate reporting of your own emissions inventory, supplier reporting of data sent upstream to a specific customer, product reporting through Product Carbon Footprints for individual parts, and assessment reporting through EcoVadis, the SAQ, or customer questionnaires. They share underlying data but differ in boundary, format, and audience.
Because they treat the four types of reporting as one undifferentiated task. Each has a different boundary and format, so work done for one does not automatically satisfy another. Building a single data foundation with inputs retained, then producing each output from it, eliminates most of the duplication.
The organizational boundary naming which entities and sites are included, the reporting period, whether Scope 2 is location-based or market-based, which Scope 3 categories are included and which were excluded, an indication of data quality, and the emissions factor sources and versions used. Without this, the number cannot be used downstream.
Usually Category 1, purchased goods and services — the materials and components you buy — because that feeds directly into their own Scope 3 inventory. They are rarely asking for a complete fifteen-category inventory. Clarifying which categories are in scope before starting saves considerable unnecessary work.
Yes, provided it is labelled as an estimate. A spend-based figure presented as measured data is a credibility problem. The same figure labelled clearly as spend-based is a reasonable first-year answer, and most customers understand that data quality improves progressively rather than arriving complete.
A simple four-level scheme works: measured, from meters, bills, or direct records; calculated, from activity data and published factors; supplier-provided, from a supplier's own inventory or PCF; and estimated, from spend or industry averages. Labelling estimates honestly builds more credibility than presenting every figure with equal confidence.
A signed and dated environmental policy, certifications such as ISO 14001 and IATF 16949, an emissions methodology note covering boundary and factors, source data including utility bills and purchasing extracts for the reporting year, a reduction initiative list with owners and status, and a supplier code of conduct if one exists.
Collect utility and fuel data on a schedule rather than reconstructing it annually, keep inputs attached to results so derivations can be retrieved rather than rebuilt, maintain the evidence pack continuously, reuse PCF methodology across parts, and log what each customer asked for, since requests repeat with the same boundaries each year.
Get Aclymate's practical sustainability content delivered weekly.
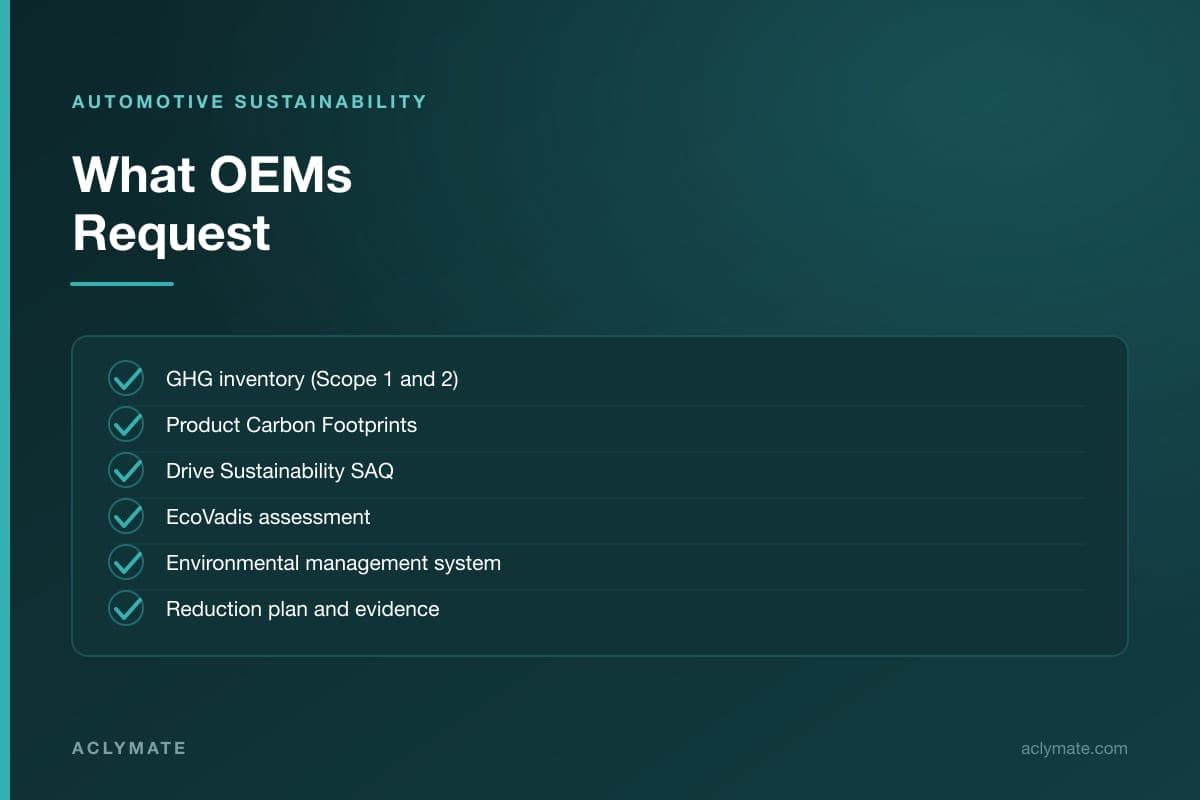
Understand the sustainability information automotive OEMs may request from suppliers, including emissions, PCFs, questionnaires, EcoVadis, and reporting.
Read Article
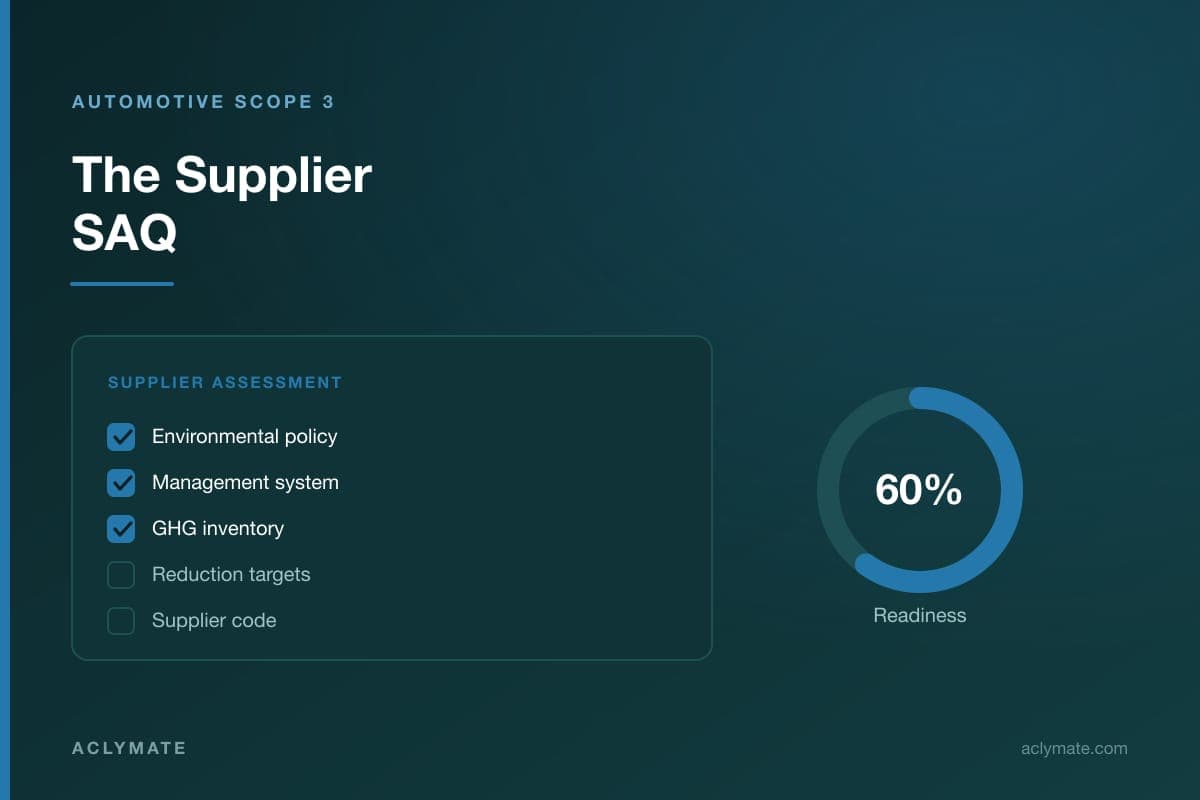
Learn what the automotive Sustainability Assessment Questionnaire asks suppliers, how it is used, and how your company can prepare.
Read Article
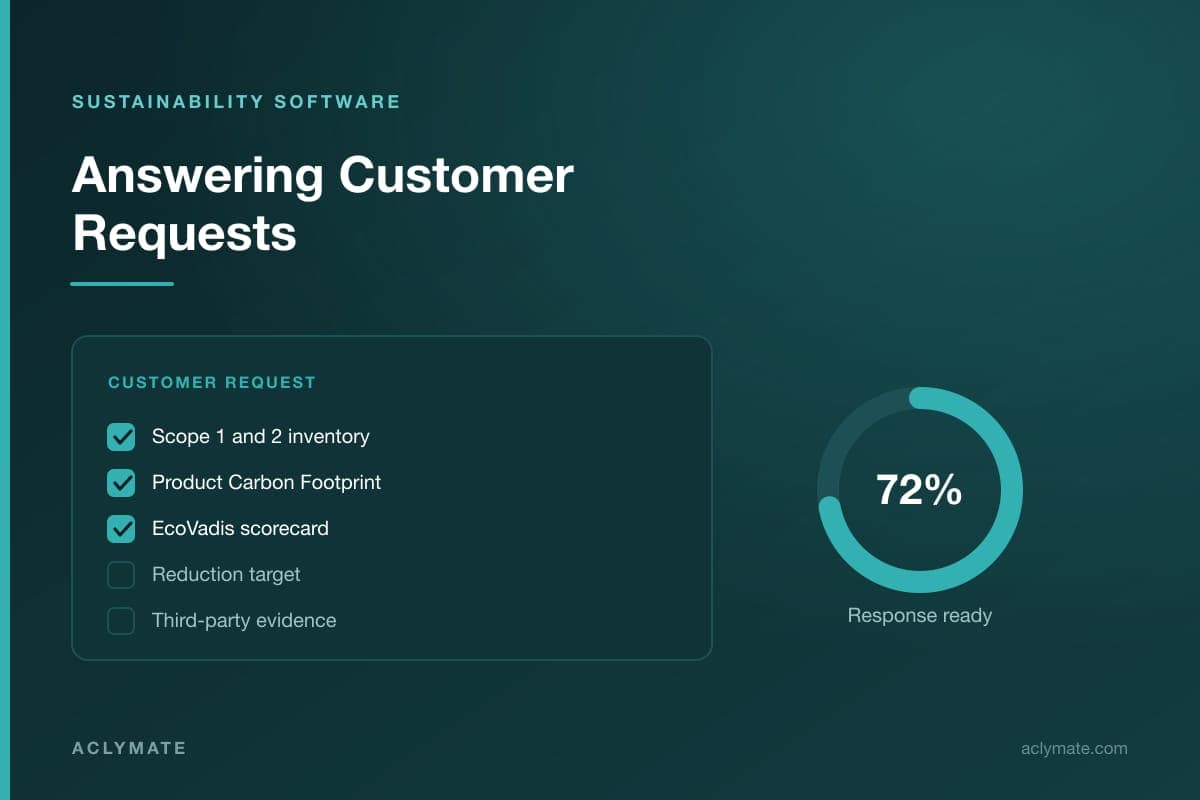
Learn how automotive suppliers can manage emissions data, sustainability questionnaires, PCFs, EcoVadis, and customer reporting requests with the right software.
Read Article
Talk with a Sustainability Expert, see a demo, or start free to put the Aclymate platform and experts to work for your team.