← Back to Insights
Aclymate Team
September 9, 2026
8 min read
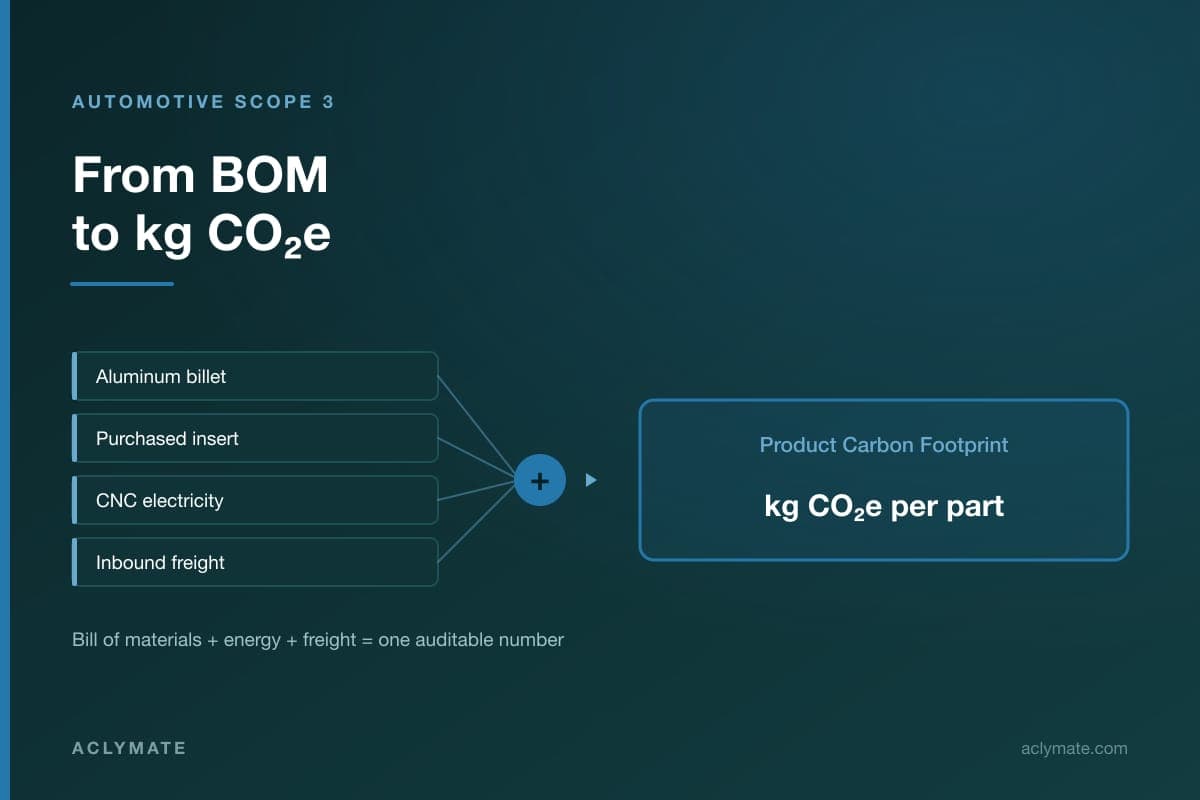
This is the step-by-step version: how to actually calculate a Product Carbon Footprint for an automotive part, using a worked example.
The example throughout is a machined aluminum bracket — a 4 kg 6061 billet, CNC-machined to a 1.4 kg finished part, with a pressed-in steel insert, shipped to a Tier 1 customer. The arithmetic transfers to stampings, moldings, castings, and assemblies.
Eleven steps.
Pick one part number. Not a product family, not a representative average — one part number, because that is what your customer asked about and what your BOM describes.
Record: part number, description, customer, annual volume, and which facility and line produces it. If the same part runs on two lines with different equipment, decide now whether you are calculating a weighted average or a line-specific figure, and state which.
The declared unit is what the final number refers to.
For most automotive components this is simply one part. For fasteners or small items it may be per 1,000 pieces. For material-like products it may be per kilogram.
Get this stated explicitly and keep it visible on the output. A PCF without a declared unit cannot be used by the recipient, and a mismatch between your unit and your customer's expectation produces errors of a thousandfold.
Also fix the boundary here. For automotive suppliers this is normally cradle-to-gate: raw materials through your manufacturing, ending at your dock. See cradle-to-gate carbon footprints.
The BOM is the backbone of the calculation. You need every material and purchased item that physically becomes part of the shipped product, plus what is consumed making it.
For the bracket:
Most suppliers already have this in an ERP or MRP system. Export it rather than retyping it; the BOM will change and you want the link, not a snapshot.
This is the step where first attempts most often go wrong.
Use purchased quantity, not finished quantity.
Our bracket ships at 1.4 kg but consumes a 4 kg billet. The emissions belong to the 4 kg, because 4 kg of aluminum was smelted, cast, and freighted. Calculating on 1.4 kg would understate the material contribution by roughly two thirds.
So:
If you do not have per-part purchased mass, derive it: annual material purchased for that part divided by annual parts produced. That also captures setup scrap and rejects, which belong in the footprint too.
Now attach an emissions factor to each material. The hierarchy, best first:
Match the factor to what you actually buy. Primary aluminum and high-recycled-content aluminum differ substantially in carbon intensity, as do blast-furnace and electric-arc-furnace steel. If your mill supplies a mill certificate that indicates route or recycled content, use it — you already have better information than a generic factor.
Record the source and level for each factor. Customers increasingly ask what share of the PCF rests on primary data, and Catena-X specifically emphasizes increasing supplier-specific primary data over time. Catena-X: Product Carbon Footprint
Here you allocate facility energy to this specific part.
The methods, best to worst:
For the bracket using machine hours: a 6-minute cycle on a machining center drawing an average 18 kW gives 1.8 kWh per part, multiplied by your grid emissions factor.
Then add the shared load. Compressed air, lighting, HVAC, process cooling, and air handling serve every part. Take total facility energy, subtract directly allocated machine energy, and distribute the remainder using a consistent rule — machine hours is usually the most defensible.
If there is heat treatment, anodizing, or painting, those are separate energy inputs, and often gas rather than electricity. Do not roll them into an electricity figure.
You have already captured most of this by using purchased mass in Step 4 — the 2.6 kg of chips carries its full material footprint because it was counted as purchased.
Two things remain:
Reject rates. If 2% of parts are scrapped after machining, the material and energy in those rejects has to be spread across the good parts. Divide by the yield: a part costing X at 100% yield costs X ÷ 0.98 at 98%.
Scrap credit. Aluminum chips are usually sold back for recycling. Whether to take a credit for that, and how much, is a methodological choice. Many automotive customers prefer a cut-off approach with no credit, which is simpler and more conservative. Whatever you choose, state it — inconsistent scrap treatment is a frequent source of disagreement between supplier and customer figures.
Cradle-to-gate includes moving materials to your facility.
You need three things per input: mass, distance, and mode.
For the bracket: aluminum billet shipped 640 km by truck; steel inserts shipped 9,000 km by ocean freight plus 300 km drayage.
Mode dominates. Ocean, rail, truck, and air differ by orders of magnitude per tonne-kilometre, so getting the mode right matters far more than precision on distance. If a shipment went by air — typically because something went wrong upstream — that alone can exceed all other transport emissions for the part.
Beyond process energy, a facility generates emissions that are not attributable to any single machine: natural gas for space heating, forklift propane, refrigerant losses, site vehicles, and waste handling.
These belong in the part footprint, allocated on the same consistent basis as shared electricity.
They are usually small relative to materials. They are worth including anyway, because a reviewer who notices they are missing will question everything else.
Sum the stages:
The result is kg CO2e per declared unit.
For a machined aluminum part the typical shape of the result is that materials dominate heavily — often the large majority — with process energy second and freight a distant third. If your breakdown looks very different, check the material mass first. That is usually where the error is.
Report the breakdown by stage, not just the total. Customers want to see where it comes from, and a breakdown makes the number reviewable.
The number is half the deliverable. The methodology note is the other half.
Record:
This is what makes a PCF defensible under review, and it is what AIAG's supplier PCF guidance pushes toward for automotive suppliers facing these requests. AIAG: Product Carbon Footprint
Everything above describes the first PCF. The point of doing it carefully is that the second should not repeat the work.
What should carry over: emissions factor library, allocation rules, freight lane assumptions, grid factors, the methodology note, and the output format your customer wants.
What changes per part: the BOM, masses, cycle time, and yield.
If your tenth PCF takes as long as your first, the calculation lives in a spreadsheet that cannot propagate a factor update — and factor updates happen annually. Aclymate's Product Footprint Pack is built to hold this structure, and PCF services cover the work for teams without capacity.
See automotive Product Carbon Footprints for the concepts behind this method, automotive Scope 3 emissions for the pillar guide, or the Automotive & Transportation page.
Define the part and declared unit, set a cradle-to-gate boundary, build the bill of materials, use purchased rather than finished material mass, attach emissions factors preferring supplier-specific data, allocate manufacturing energy on a defensible basis, account for scrap and yield, add inbound freight, allocate shared facility emissions, sum to kg CO2e per part, and document every assumption.
Purchased mass. A bracket shipping at 1.4 kg that consumes a 4 kg billet carries the emissions of the full 4 kg, because that quantity was smelted, cast, and freighted. Calculating on finished mass would understate the material contribution by roughly two thirds, which is the most common error in first attempts.
Submetering is best where available. Otherwise use machine hours: cycle time multiplied by measured or rated power draw. A six-minute cycle at an average 18 kW gives 1.8 kWh per part. Then distribute shared load from compressed air, lighting, and HVAC using the same consistent rule, usually machine hours.
Divide by yield. If 2% of parts are scrapped after machining, the material and energy consumed by those rejects must be spread across the good parts, so a footprint of X at 100% yield becomes X divided by 0.98 at 98% yield. Setup scrap should be captured the same way.
It is a methodological choice, and many automotive customers prefer a cut-off approach with no credit because it is simpler and more conservative. What matters most is stating clearly which treatment you used and applying it consistently, since inconsistent scrap treatment is a frequent source of supplier and customer disagreement.
Materials, usually by a wide margin, with process energy second and inbound freight a distant third. If your calculated breakdown looks very different from that pattern, check the material mass first, since using finished rather than purchased mass is the most common source of an implausible result.
Because ocean, rail, truck, and air freight differ by orders of magnitude per tonne-kilometre. Getting the mode right matters far more than precise distances. A single air shipment, usually triggered by an upstream quality or scheduling problem, can exceed all other transport emissions for that part.
Declared unit and boundary, reporting period and validity, emissions factor sources and versions, the energy allocation method and rationale, scrap treatment including whether a credit was taken, data quality for each input, the primary-data share, and any known limitations. The methodology note is half the deliverable.
Because the emissions factor library, allocation rules, freight lane assumptions, grid factors, methodology note, and output format all carry over. Only the bill of materials, masses, cycle time, and yield change per part. If the tenth takes as long as the first, the calculation is trapped in a spreadsheet that cannot propagate factor updates.
Get Aclymate's practical sustainability content delivered weekly.
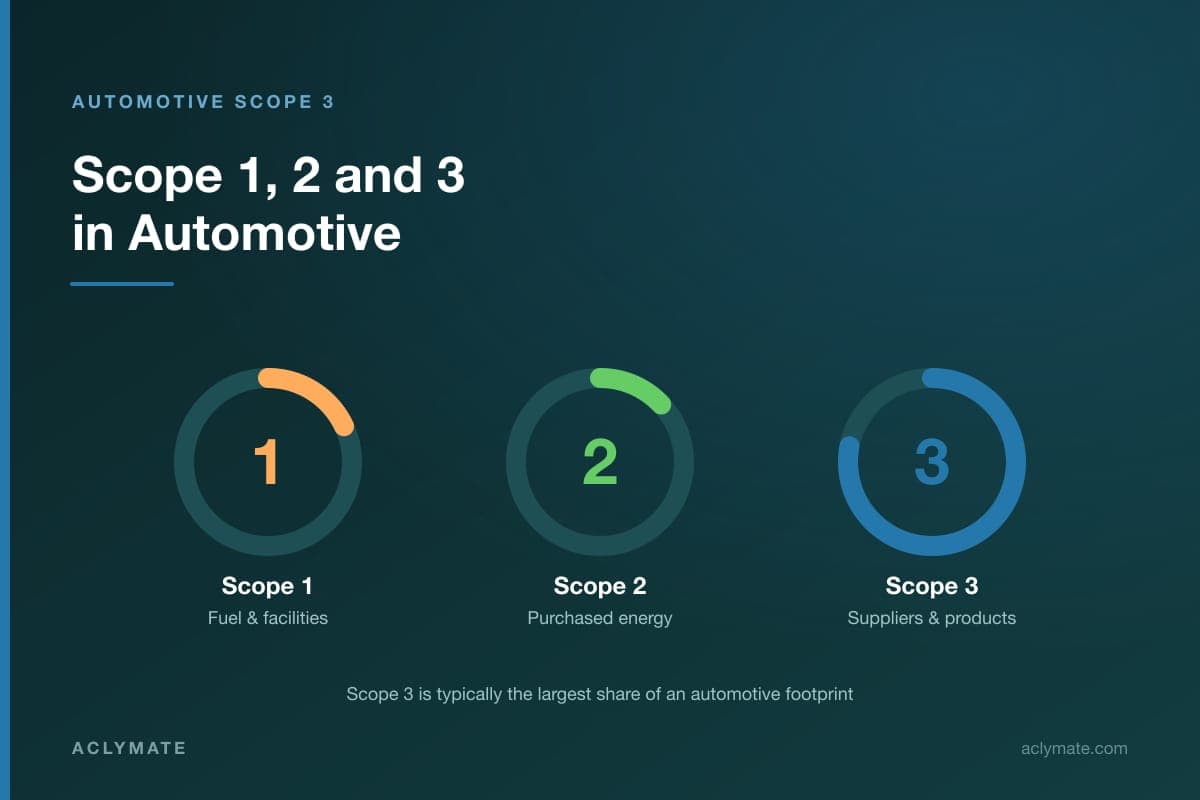
Learn how automotive companies measure Scope 3 emissions, collect supplier data, calculate product footprints, and meet customer reporting requirements.
Read Article
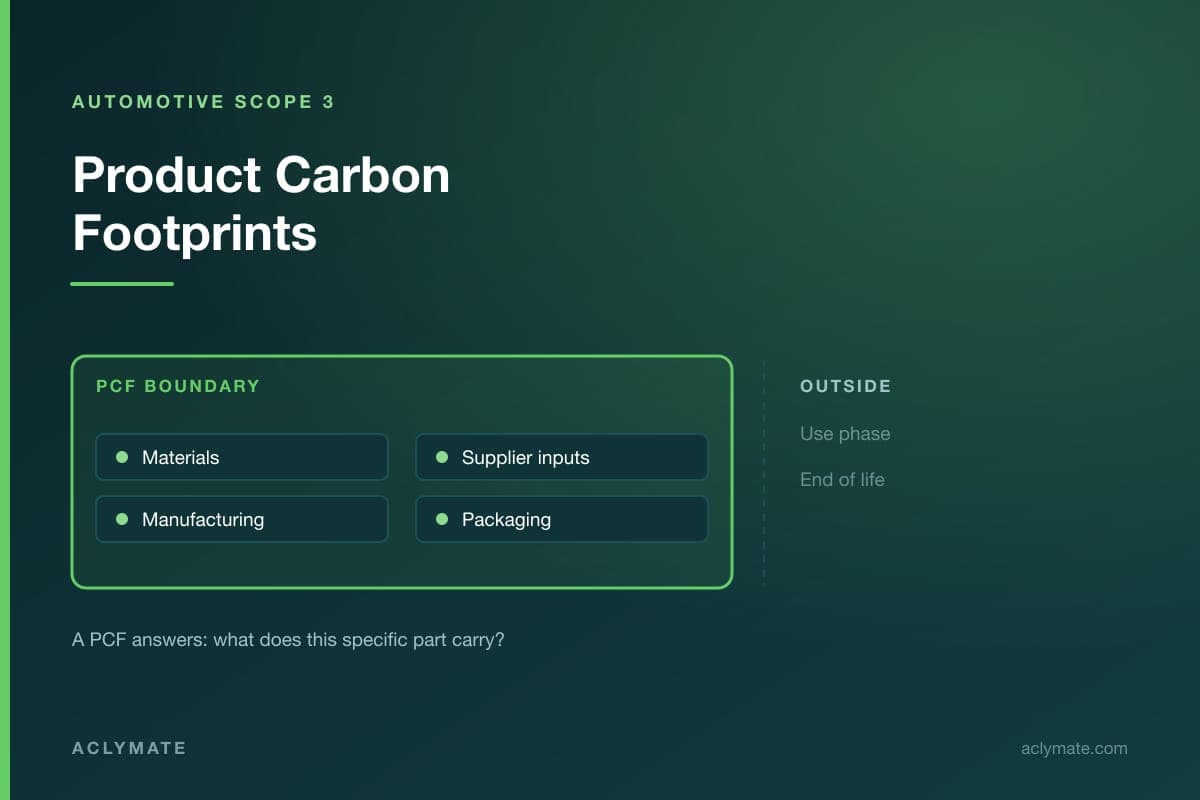
Learn how automotive Product Carbon Footprints measure emissions from materials, suppliers, manufacturing, transportation, and components.
Read Article
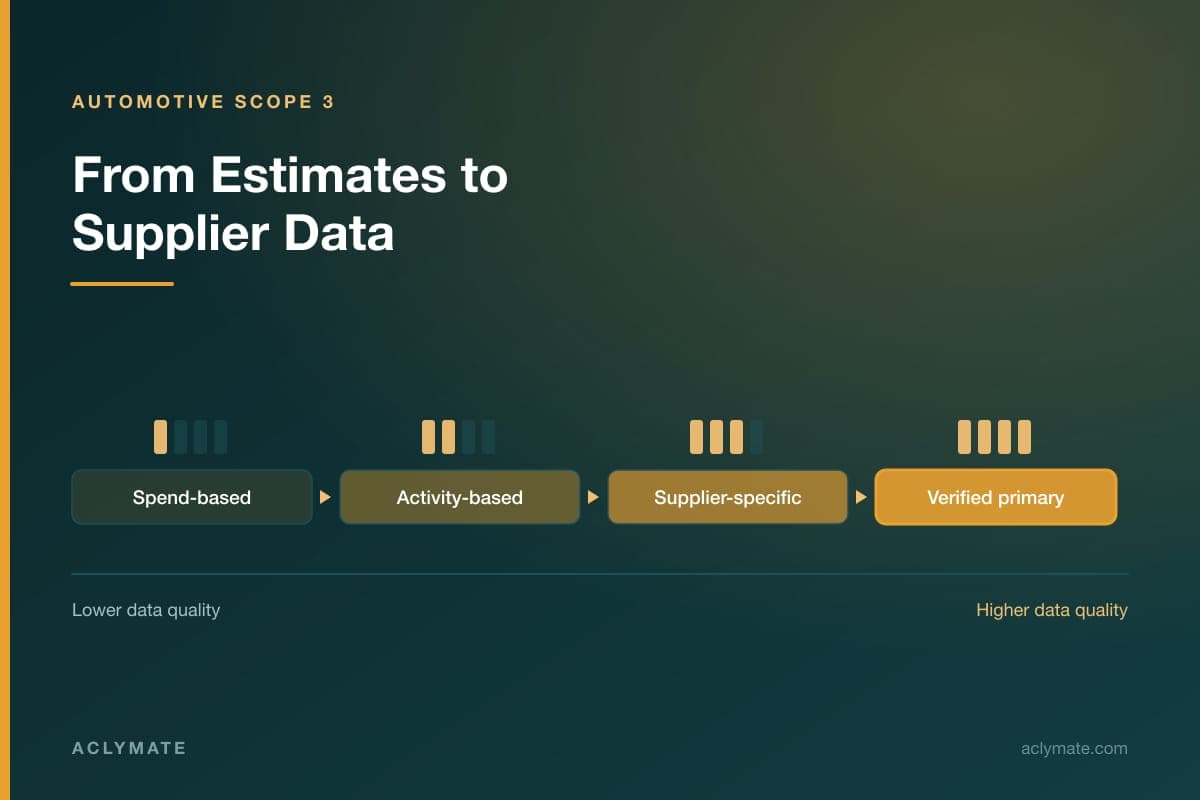
Learn what Scope 3 supplier data automotive companies need, how to collect it, improve data quality, and engage suppliers effectively.
Read Article
Talk with a Sustainability Expert, see a demo, or start free to put the Aclymate platform and experts to work for your team.