← Back to Insights
Aclymate Team
August 31, 2026
7 min read
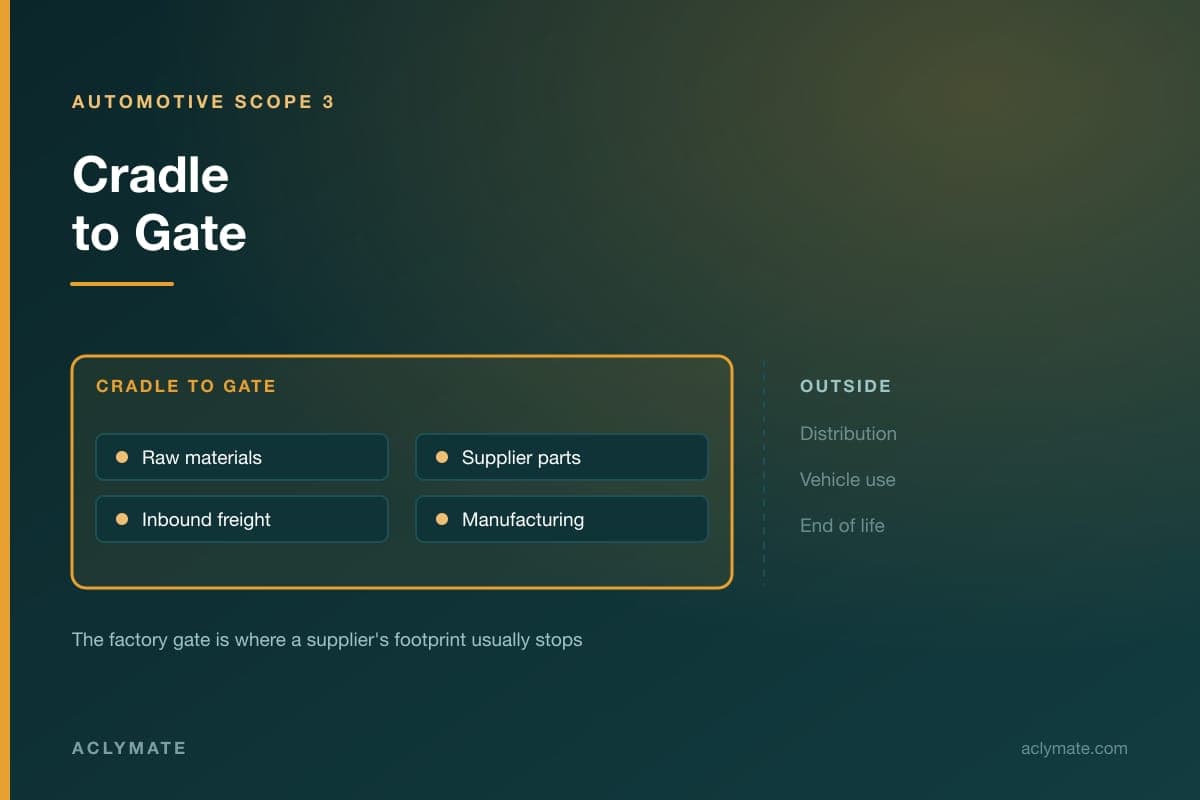
Cradle-to-gate is the boundary automotive suppliers are most often asked to report against — and boundary disputes are the most common reason two companies calculate different footprints for the same part.
This guide covers exactly where the boundary starts and stops, what belongs inside it, and the methodological choices within it that produce the most disagreement.
Cradle-to-gate covers emissions from raw material extraction through to the point a product leaves the producing facility.
The chain: raw material extraction → material processing → supplier manufacturing → inbound transportation → your manufacturing → factory gate.
The "gate" is your shipping dock. Everything after it — outbound distribution, the customer's assembly, the vehicle's use phase, end-of-life — is outside.
The boundary exists because it matches responsibility. You know what you purchased, what you did to it, and what shipped. What happens to the part afterward is determined by your customer, so it belongs in their boundary.
Inside:
Outside:
One nuance worth flagging: outbound freight is excluded from your cradle-to-gate footprint, but your customer will usually add it to their own calculation. Do not include it unless they explicitly ask, and if you do include it, report it as a separate line rather than folding it into the total.
For most automotive parts, materials are the largest contributor by a wide margin.
The two decisions that matter:
Quantity: use purchased mass, not shipped mass. A machined component may start as a 4 kg billet and leave as 1.4 kg. Four kilograms of aluminum were smelted and transported; the emissions belong to four kilograms. Using finished mass is the single most common error in supplier PCFs.
Factor: match the actual production route. Primary aluminum and high-recycled-content aluminum have materially different carbon intensities, as do blast-furnace and electric-arc-furnace steel. Where a mill certificate tells you the route or recycled content, use it rather than a generic factor. You already have better data than the average.
Components you buy and incorporate carry their own embedded footprint.
Preference order for the factor you attach:
Record which level each input came from. This becomes your primary-data share, which customers increasingly request alongside the number.
Where a supplier provides a PCF, check three things before using it:
Catena-X is working toward harmonized calculation and exchange precisely so these checks become unnecessary, with an emphasis on increasing supplier-specific primary data over time. Catena-X: Product Carbon Footprint
Your own processing energy is the second largest contributor for most parts.
It has two components:
Direct process energy — the machine running the part. Best measured by submeter; otherwise machine hours multiplied by measured or rated draw.
Shared facility load — compressed air, lighting, HVAC, process cooling, air handling. These serve every part, so take total facility energy, subtract directly allocated machine energy, and distribute the remainder on a consistent basis.
Do not merge gas and electricity into one figure. Heat treatment, anodizing, and paint ovens are frequently gas-fired, and they carry a different emissions factor from grid electricity.
Inbound freight is in scope: every leg that brings a material or component to your facility.
Per input you need mass, distance, and mode. Mode dominates — ocean, rail, truck, and air differ by orders of magnitude per tonne-kilometre — so mode accuracy matters far more than distance precision.
Watch for multi-leg journeys. An imported component may travel by ocean, then rail, then truck. Counting only the final truck leg understates it substantially.
Handled correctly, most scrap is already captured by using purchased mass. Two items remain.
Yield. Parts rejected after processing consumed material and energy that must be spread across the good parts. Divide the per-part figure by the yield fraction.
Scrap credit. Whether to reduce the footprint to reflect material sold for recycling is a genuine methodological choice with no universally correct answer.
Whichever you choose, state it prominently. A supplier using avoided burden and a customer assuming cut-off will disagree about the same part, and neither will initially understand why.
Allocation is where two competent analysts most often reach different numbers.
Energy allocation — distributing facility energy across parts. Best to worst: submetered, machine hours, mass processed, production volume, revenue share. Revenue share is quick and hard to defend, because it assumes energy intensity tracks price.
Co-product allocation — where one process yields multiple saleable outputs, splitting emissions between them by mass, economic value, or physical relationship. Mass is usually easiest to defend; economic allocation shifts whenever prices move.
Multi-site allocation — where a part passes through more than one of your facilities, each contributes its own energy.
Document the rule and apply it consistently across all parts. Consistency matters more than picking the theoretically optimal method, because inconsistency makes your whole dataset unreviewable.
Cradle-to-grave extends through distribution, use, and end-of-life.
For an OEM assessing a complete vehicle this is the relevant boundary, because the use phase is substantial. For a component supplier it is usually not appropriate and often not calculable — you cannot know how a bracket will be used, for how long, or how it will be disposed of.
If a customer asks a component supplier for cradle-to-grave, it is worth clarifying. Frequently they want cradle-to-gate and are using the terms loosely.
The recurring ones, in rough order of frequency:
Most of these are avoidable at the point of setting up the calculation, which is why the structure of the first PCF matters more than the arithmetic.
See how to calculate a PCF for an automotive part for the worked example, automotive Product Carbon Footprints for the concepts, or automotive Scope 3 emissions for the pillar guide. The Automotive & Transportation page covers the wider offering.
Cradle-to-gate covers emissions from raw material extraction through material processing, supplier manufacturing, inbound transportation, and your own manufacturing, ending when the product leaves your shipping dock. It excludes outbound distribution, your customer's assembly, the vehicle's use phase, and end-of-life treatment.
No. The gate is your shipping dock, so outbound freight sits outside your boundary. Your customer will typically add it to their own calculation as their inbound freight. If a customer asks you to include it, report it as a separate line rather than folding it into the total.
Three things. The boundary, because if theirs is also cradle-to-gate their outbound freight to you is excluded and you must add it as your inbound. The declared unit, since per part versus per kilogram mismatches cause thousandfold errors. And the period, because an old footprint may use superseded emissions factors.
Cut-off takes no credit — scrap simply leaves your boundary. It is simpler, more conservative, and what many automotive customers prefer. Avoided burden claims a credit for displacing primary material, which is more favorable to your number but more contested. Either is defensible if stated clearly and applied consistently.
Take total facility energy, subtract energy directly allocated to machines, and distribute the remainder using a consistent rule — machine hours is usually the most defensible. Compressed air, lighting, HVAC, process cooling, and air handling serve every part, so omitting them understates the footprint.
Usually not. Cradle-to-grave extends through distribution, use, and end-of-life, which is appropriate for an OEM assessing a complete vehicle but generally not calculable for a component supplier who cannot know how a part will be used or disposed of. If a customer asks, it is worth clarifying what they actually need.
Using finished mass instead of purchased mass. A part shipping at 1.4 kg from a 4 kg billet carries the emissions of 4 kg, because that quantity was smelted, processed, and transported. Using shipped mass can understate material emissions by more than half, and materials usually dominate the total.
Consistency matters more than optimality. Document the allocation rule and apply it identically across all parts. A defensible method applied consistently produces a reviewable dataset. Switching methods between parts, even toward a better method, makes the whole set impossible for a customer to compare or verify.
Get Aclymate's practical sustainability content delivered weekly.
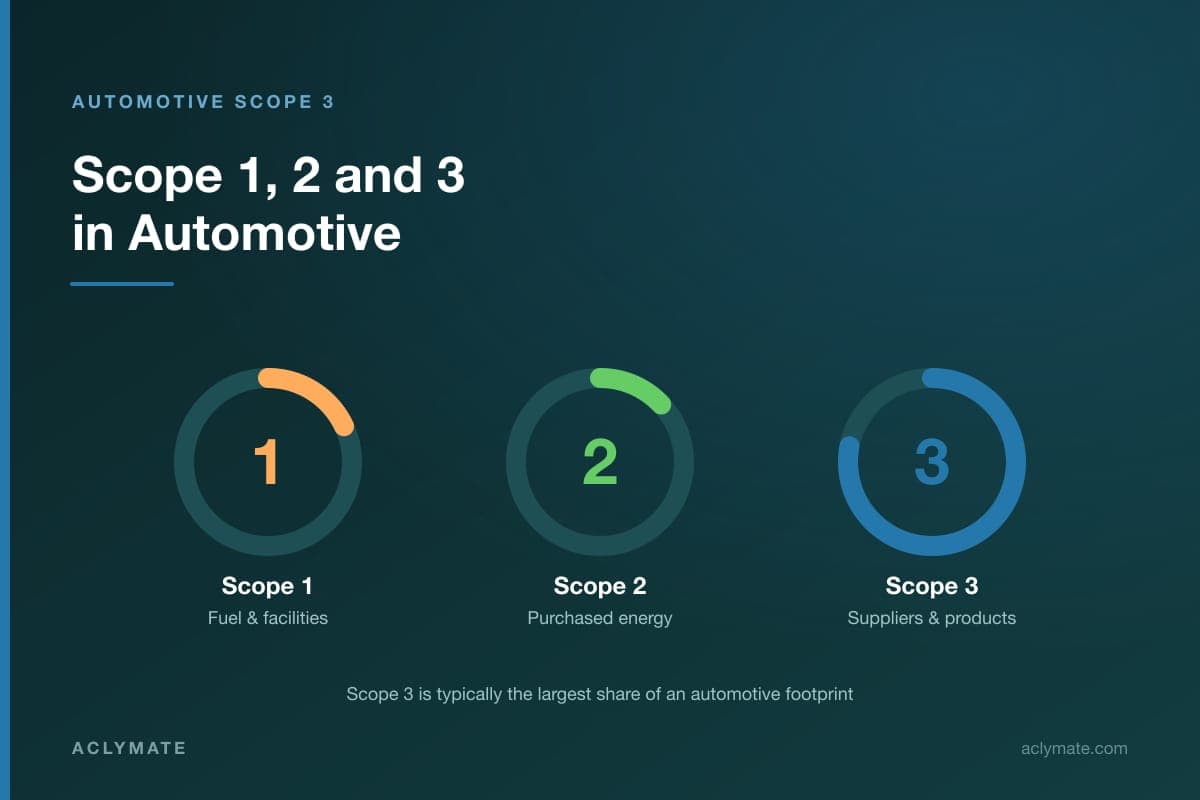
Learn how automotive companies measure Scope 3 emissions, collect supplier data, calculate product footprints, and meet customer reporting requirements.
Read Article
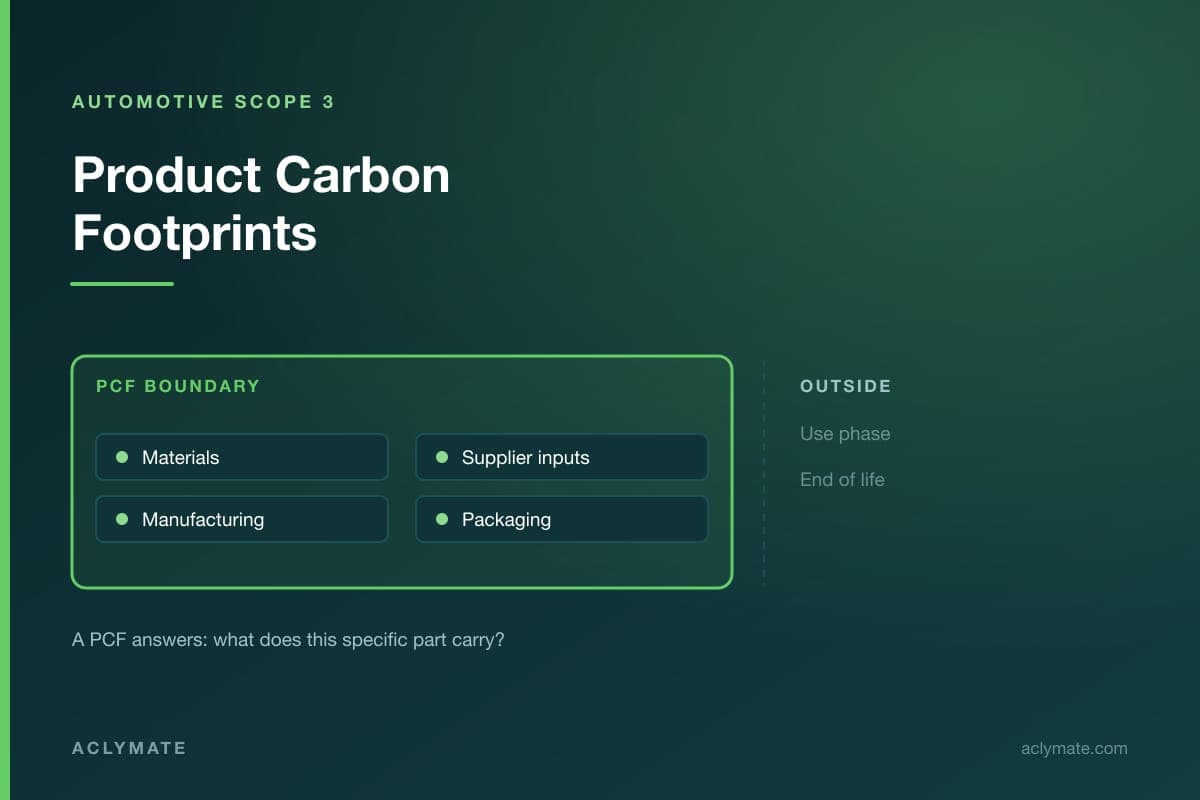
Learn how automotive Product Carbon Footprints measure emissions from materials, suppliers, manufacturing, transportation, and components.
Read Article
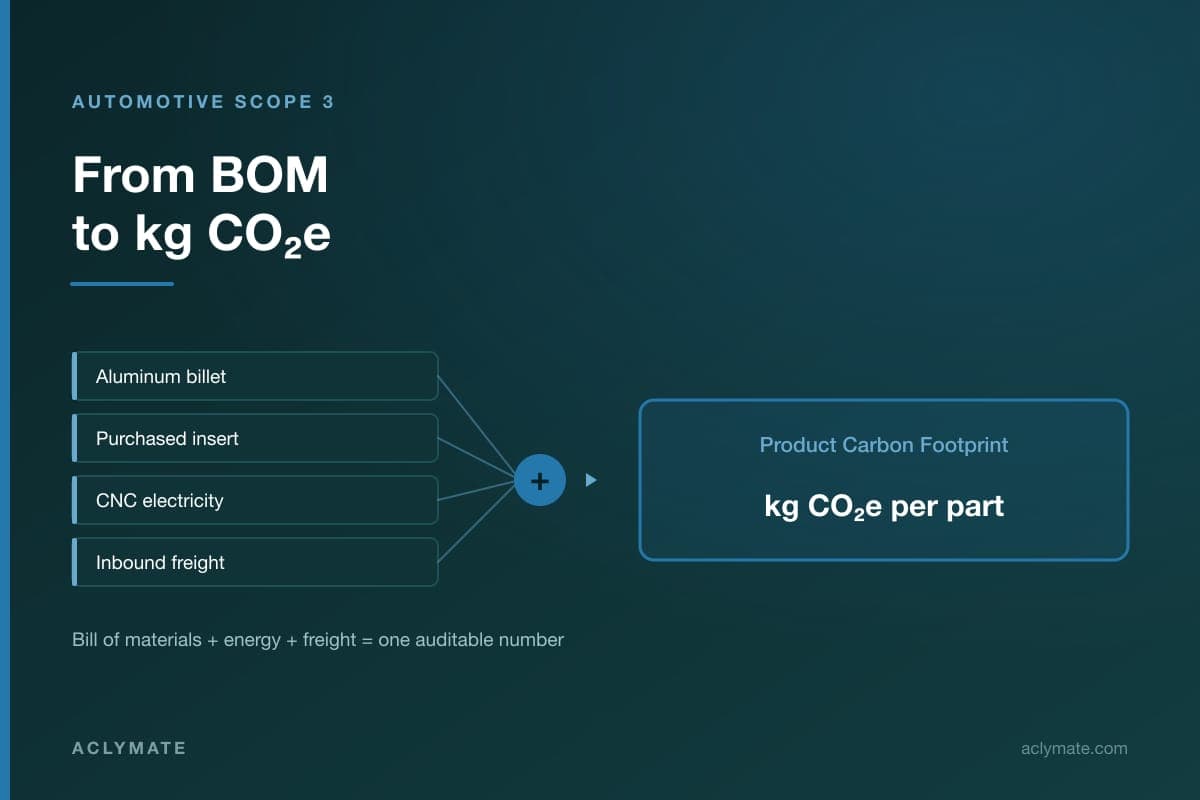
Learn how to calculate the carbon footprint of an automotive part using BOMs, materials, energy, suppliers, manufacturing, and transportation.
Read Article
Talk with a Sustainability Expert, see a demo, or start free to put the Aclymate platform and experts to work for your team.